Showing posts with label lebron james. Show all posts

Tuesday, March 7, 2017

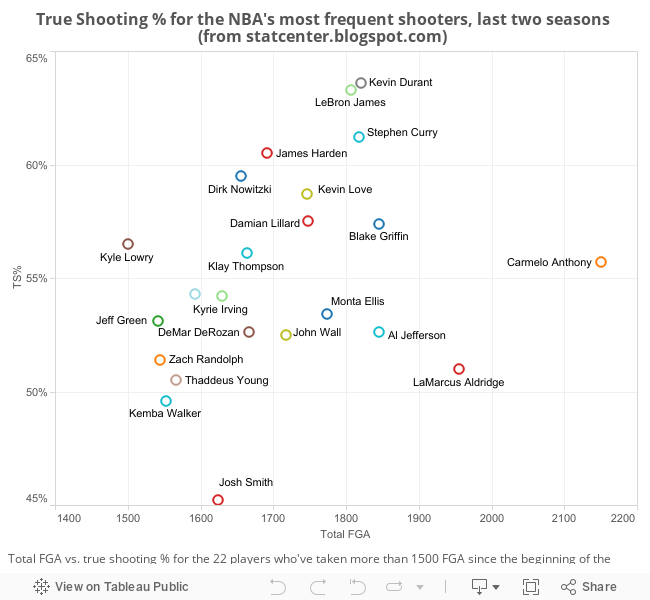
Usage vs efficiency for NBA's highest-usage players

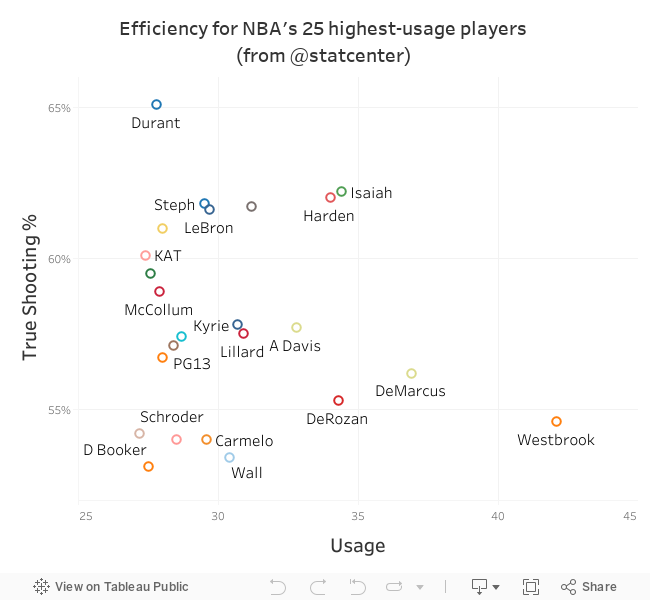
Here's how the NBA's 25 highest-usage players stack up in efficiency for the 2016-17 season (as of March 7):


It's hard to describe what Russell Westbrook is doing, except to say he's simply playing a different sport than everyone else. Has anyone every combined impact and inefficiency to this extent before?

Wednesday, June 8, 2016

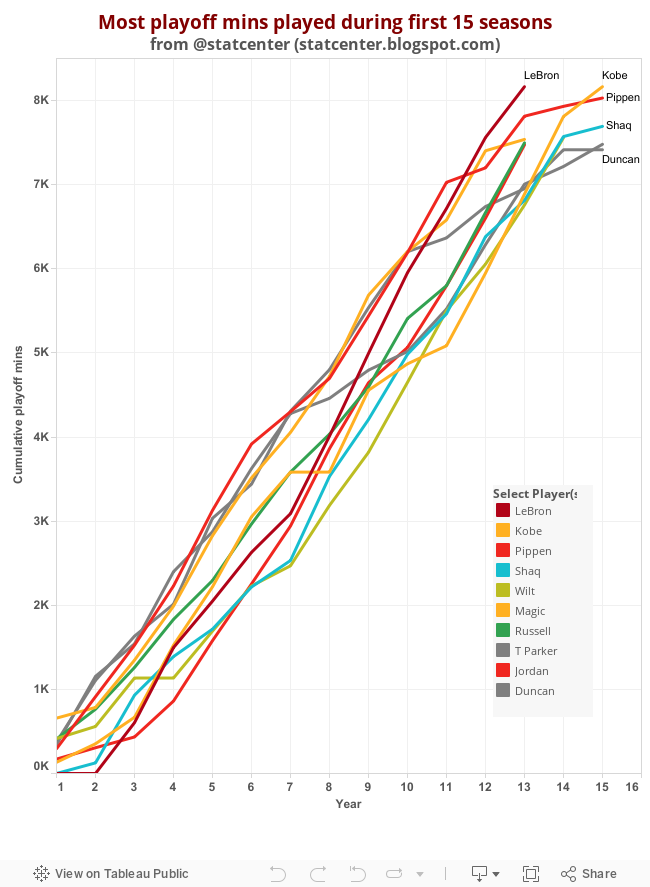
LeBron is playing playoff minutes like no one... ever

LeBron James has piled up more playoff minutes than anyone ever has through their first 15 seasons. Important: he's only in season 13.


What could possibly make LeBron's tally even more impressive? Consider:

  • He's not done with season 13 yet!
  • James was only 41st in playoff mins through his first five seasons, thanks to missing the playoffs completely his first two years.

Tuesday, December 8, 2015

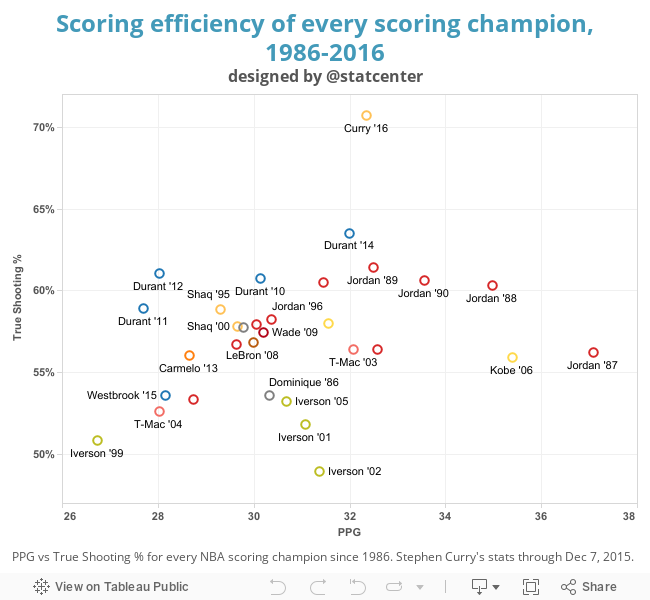
Sorry KD and MJ: Steph Curry's redefining efficiency

Through 22 games, Stephen Curry is on pace to become the most efficient NBA scoring champion in modern NBA history (since 1985-86). Aaaand, it ain't close.


(Having trouble viewing the image? Click here.)
Some thoughts:

  • Over the past 30 years, the two gold standards for scoring volume and efficiency have been Michael Jordan and Kevin Durant. It's only been 22 games, but Steph is absolutely obliterating them and every other scoring champ. (Also, 22 games is actually a fair sample size when you're looking at something so freakish.)
  • Kobe Bryant '06 was such a force of nature.
  • That Allen Iverson MVP is looking grim in retrospect. Actually, I'm not sure it looked that pretty in the moment either.

Thursday, April 16, 2015

Threes and frees: James Harden is the all-time king

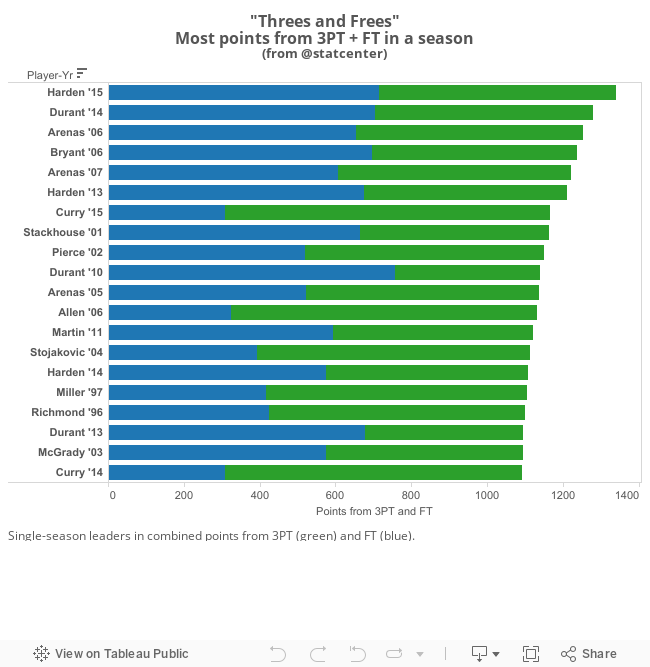
Daryl Morey's vision for the Rockets is built upon taking and making the most efficient shots on the court: two-pointers at the rim, free throws,and three-point shots. We don't have historical data for layups and dunks, but we can take a look at who's scored the most points from 3PT and FT in a season.


(Having trouble seeing the chart? Click here.)

Conclusion: James Harden is Daryl Morey's cyborg.

It's hard to imagine that just three years ago, it wasn't clear whether or not Harden was worth a max contract. As is often the case, the theme here is fit really matters. Would Harden still be an All-Star in a more conventional offensive scheme? Sure. But would he singlehandedly push the boundaries of shot efficiency? Probably not.

A couple of other notes:

  • Harden unseats former teammate Kevin Durant from the top spot by ever-so-slightly edging him in both 3PT and FT made. Harden attempted 64 more three's than KD did last season.
  • Gilbert Arenas with two of the top 5 on this list? Yessir. Gil's 2005-06 season is almost identical to Harden this season in terms of 3P% (37.5% vs 36.9%) and 3PA (555 vs 540). But Harden shot much better (and a little more frequently) at the charity stripe.
  • Stephen Curry followed up his top-20 all-time finish last season with an even better show this time. All it took to get to the top 10 was nailing 44% of his threes and missing only 29 FTs all season. Read that last sentence again.
  • The all-time leader without making a single 3PT? That would be Jerry West, with 840 freebies in 1966. Wilt Chamberlain is just behind him with 835 free throws made in 1962. Of course, it took Wilt almost 400 more attempts than West.
  • In case you were wondering: LeBron James reached his "threes and frees" peak in 2008-09,when he scored 990 combined points from those areas. That's good for 32nd all-time (incidentally, he also has spots 33 and 34 on the list).

Monday, December 22, 2014

Monday, November 10, 2014

Usage vs efficiency for the new season's top scorers

Of course it's early, but...

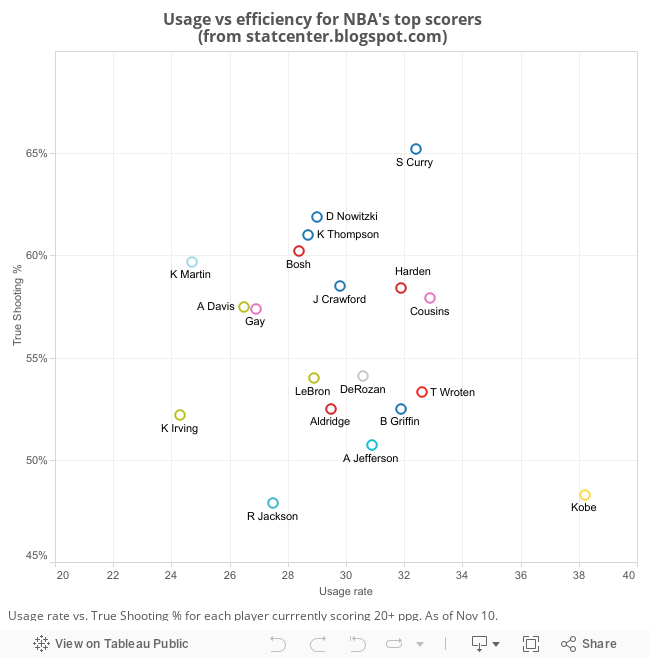
Let's take a look at the usage and true shooting percentage for each of the NBA's 20 ppg scorers right now.


(Having trouble seeing the visualization? Click here.)

Some takeaways:

  • Dear Stephen Curry: if you intend to continue shooting 57% on twos, 41% on threes, and 97% on FT's, can we just time-machine out to May and watch you in the second round of the playoffs? Please?
  • Kobe Bryant... look, his true shooting percentage is 48%. The rest of the Lakers: 56%.  Even if you want to argue Kobe's presence frees up space for others, that's an imbalance that simply doesn't mesh with a 38% usage rate.
  • Tony Wroten? Tony Wroten! For all of his (and his team's) faults, TW can certainly get to the line (8+ attempts per game). It's a shame he doesn't hit more than 65% of them. That's inexcusable for a guard.
  • James Harden is actually tied with Mr. Bryant for the lowest FG% of anyone on the chart. But he's getting to the line an almost comical 10.9 times per game - and hitting 90% of them. Don't let the visceral ugliness of James' game distract from its lethal potency.

Thursday, March 20, 2014

Top dunkers in the NBA this year

Who dunks the most in the NBA? Who misses dunks most often - and who never misses?


Can't see the charts? Click here.

Some takeaways:
  • Shocker: DeAndre Jordan and Blake Griffin both dunk a lot! Slightly bigger shocker: DeAndre also misses a lot of dunks - 26 so far this year, nearly 12% of his attempts. No one else has missed more than 16, which leads us to...
  • Plumlee! Yes, Miles Plumlee has thrown it down more this year than Mason Plumlee, but Miles has also missed over 15% of his attempts. Mason has missed only 6%.
  • Go figure: dunks are yet another category where LeBron James and Kevin Durant lead the league in efficiency (at least among the 20 leading dunkers).
  • Josh Smith: 97% FG on dunks, 25% on 3PT. Good thing he's jacked up 150 more three-point attempts than dunk attempts.
  • Now, if you're looking for dunking perfection (as in never missing), Robin Lopez and Markieff Morris are your men. Meanwhile, Marcus Morris is a modest 10-of-11 on jams this year. (Aside: what's with brothers and dunking?)

By the way, last year's top 5 in dunks: Blake, Dwight Howard, DeAndre, JaVale McGee, and LeBron.


Data source: basketball-reference.com

Tuesday, March 11, 2014

How this year's title contenders compare to past NBA champions

There are, by my count, eight legitimate (or semi-legitimate) title contenders in the NBA this year - seven teams that are winning more than 2/3 of their games, plus the Warriors who are 7th in overall efficiency. I wanted to look at how those contenders compare to the past ten NBA champions in terms of offensive and defensive efficiency.

I'm using offensive (defensive) efficiency index, which basically means comparing each team's points scored (allowed) per 100 possessions to their league average that year. A higher offensive index (and lower defensive index) is better.

Here we go - and remember, teams want to be as close to the top right corner of this chart as possible:

(Having trouble seeing the chart? Click here.)

Some takeaways:
  •  Everyone considers the 2014 Heat legitimate title contenders - and rightfully so, given their track record and ability to seemingly "turn it on" in the playoffs. (And presumably more minutes for LeBron James and Dwyane Wade.) And it seems an increasing number of fans and media are placing the Clippers and Rockets into the contender bucket as well, especially with how well Blake Griffin played in Chris Paul's absence, and Dwight Howard's impact on the Rockets' half-court D. But it's worth noting that no champion in the past 10 years as been as average on defense as the 2014 Heat, Clips, or Rockets. Every one of those recent champs was at least 4% better on defense than the league average, and half of them were at least 7% better than average. The Clips are actually tied with the 2006 Heat right now, so it's certainly possible they overtake them soon. Now for the optimists out there, take a gander at those three teams on offense -  they're more efficient compared to their peers than any recent champ, except for last year's Heat squad. This year's playoffs could be more offense-first than any recent edition.
  • Except that Indiana is prominently involved. This year's Pacers aren't LIKE the 2004 Pistons - they ARE the 2004 Pistons. The raw numbers (and the early-season ascent of Paul George) might mask that fact, but consider how the league has evolved over the past decade. The average team in 2004 scored 102.9 points per 100 possessions, and in no season since then has the average been below 104.6 pts / 100 possessions. This year, the league average is a hair under 106 pts / 100 possessions. When you account for more dynamic offense across the board, Indiana this year looks even better on defense (thanks, Roy Hibbert!) - and even worse on offense.
  • The Spurs and Thunder. I mean, what is there to say? They've probably been the most impacted by injuries (Russell Westbrook, Tony Parker) of any of this year's top 8, and yet they still sport the best balance of elite offense and really superb defense. I don't think most fans recognize how incredible Tim Duncan has been on both ends of the court this year - he's top-five in the NBA in both blocks and defensive rebounding while leading the Spurs in total minutes. As for OKC, I'm really intrigued by the proximity of this year's squad to the 2009 Lakers on this chart - that seems like an excellent comp, in terms of one elite scorer (though Kevin Durant is more efficient than Kobe Bryant five years ago), an All-Star #2 on offense, and an underrated smothering defense.
  • Maybe I should stop calling the Blazers a contender. Adjusted for pace and season, they're less efficient on defense than the "Seven Seconds or Less" 2006 Suns. And their Damian Lillard-fueled offense is outstanding... but still only 4th-best in the NBA. That's not a recipe for winning two payoff rounds, much less four.
  • The Warriors, though - OK, they have to make the playoffs first. Fine. But the defense is right in line with championship standards. On the other side of the ledger, raise your hand if you thought a Stephen Curry-led offense would be less relatively efficient than the 2005 Spurs.
Data sources: NBA.com/stats, basketball-reference.com

Thursday, February 6, 2014

All-time top scorers through first 7 seasons

Since Kevin Durant is in his 7th season, and destroying everyone in his path, it seemed like a good time to ask: how does he stack up against other all-time scorers through their first seven seasons?

There's an easy way to answer this: just look at the all-time chart. But... there are a couple of problems with simply looking at total points:

  • It doesn't account for pace. During Wilt Chamberlain's first three seasons, NBA teams averaged 126 possessions per game. LeBron James started his career with teams averaging about 90 possessions per game. We need to account for this enormous difference to get a more accurate barometer of scoring prowess.
  • Not all seasons have had 82 games. Elgin Baylor played in seasons as short as 75 games, then 75, 79, and 80. Same for Wilt, Jerry West, and Oscar Robertson. Meanwhile, Durant got hit with a lockout-shortened season in 2011-12, and obviously hasn't finished this season either.
So I adjusted Basketball Reference's numbers to an average-pace season (about 107 possessions per game), and I projected everybody's historical stats to 82 potential games played. (Note: we don't make any such allowance for injury, because that's more within a player's control and not a league-wide phenomenon.)

Alright, enough chit-chat. Here are the (adjusted) top scorers in NBA history through their first seven seasons.


(Having trouble seeing this chart? Click here.)

Some takeaways:

  • You can adjust for a lightning-fast pace, or anything else you want, but no one can touch Wilt. He had 21,486 actual points; our adjustments bring him down to under 20K, but he's still more than 1,500 points ahead of LeBron James.
  • Actually, Michael Jordan COULD have approached Wilt, had it not been for missing most of his second season with a broken foot. If you look just at seasons 3-7, Michael had more pace-adjusted points than even Wilt, so it's entirely possible he would've been the greatest scorer ever through 7 seasons.
  • Durant benefits greatly from the pace adjustment: without it, he would probably end this season about 8th on the list. With the adjustment, he's 4th (and if he scores like a madman the rest of this season, it's conceivable he could move up to 2nd, though it's very unlikely).
  • By the way, the average league pace during Durant's career has been 92.3. That's the second-slowest of anyone on the list (LeBron's first 7 years averaged a glacial 91.5.)
  • David Robinson passes Kareem Abdul-Jabbar in years 6 and 7 to finish 5th on the list. I knew the Admiral was a great scorer, but I didn't think he'd be the second-best scoring center in history through 7 seasons.
  • Elvin Hayes was actually 2nd in most FGA (and minutes) through his first 7 seasons, behind only Wilt. Alas, with a 44% FG, he doesn't make the top ten in pace-adjusted points.
  • Karl Malone! Dominique Wilkins! The 80's really were a magical time for superstar scorers. (By the way, in case you were wondering, Larry Bird was 15th on the all-time unadjusted list.)

Thursday, January 30, 2014

Kevin Durant vs. LeBron James, game by game

Here's a look at how Kevin Durant and LeBron James have progressed throughout the 2013-14 season, as measured by average overall Game Score. (Game Score was created by John Hollinger to give a rough measure of a player's productivity for a single game. The scale is similar to that of points scored, (25 is an excellent performance, 10 is an average performance, etc.)


(Having trouble seeing this chart? Click here.)

Wednesday, January 22, 2014

Driving to the basket: Who's the best?

Here are the 25 NBA players (through Jan 20) who drive to the basket the most, mapped against their FG% on those drives. (NBA.com defines drives as "any touch that starts at least 20 feet from the hoop and is dribbled within 10 feet of the hoop and excludes fast breaks.")


(Having trouble seeing this chart? Click here.)

Some takeaways:

  • In terms of sheer volume of drives, Tony Parker, Ty Lawson and Monta Ellis are in a class by themselves. They also produce quality along with that quantity, albeit each in different ways. Lawson is excellent at finishing, but even better at setting up teammates with drive-and-kicks; no one in the NBA produces more team points directly from drives than Ty's 13.1 ppg. Parker, with his array of floaters and either-hand layups and scoops, is the best pure finisher of the trio. And Monta is the best (this year, at least) at drawing fouls from drives. He's actually leading the league with 8.0 individual ppg from drives.
  • Jeremy Lin, everybody! This chart highlights Lin's biggest strength - the ability to drive and finish creatively. He may be a third guard at this point, but what a third guard. By the way, look at Lin, James Harden, and Chandler Parsons all bunched together on this chart. They're combining for 22 drives per game, shooting a combined 53% on those drives, and obviously hitting each other for open threes along the way. That's an incredibly efficient, dynamic foundation for an offense... especially with Dwight Howard waiting inside.
  • Maybe LeBron James should be driving to the basket more? Maybe we could say the same (to a lesser extent) about Kevin Durant? The truth is, of course, that even for the two best drive-finishers in the game, it's a bit more complicated than that. Driving takes energy, and it's hard to achieve when the entire defense is focused on you. I expect both of them will penetrating a lot more in the playoffs. They'll be playing more minutes, and playing those minutes with Dwayne Wade and Russell Westbrook, respectively, should open up the court.
  • Five of the six lowest on this chart in terms of FG% are quick guards who aren't necessarily known for their strength (except perhaps Dion Waiters, but he has the separate problem of not actually knowing how to play basketball). That's not to say guys like Brandon Jennings, Jeff Teague and Kemba Walker aren't valuable on drives, but that they're a little easier to control from a team defense perspective than guards like Parker and Lawson.
  • Damian Lillard isn't far from being the perfect offensive point guard, and he's already at the helm of the best offense in the NBA right now. But his troubles finishing drives are probably his biggest limitation right now. If he can improve to just league-average at that, combined with Portland's other three-point shooters and LaMarcus Aldridge draining shots from the elbow and post... oof. Good luck stopping that.
UPDATE: A Tableau user named "RS" extended my data by looking at teammate points per drive and overall points generated. Check out his / her awesome work here.

Friday, January 10, 2014

The masters of getting to the free-throw line

Here's a chart of the 25 players who are getting to the free throw line the most this season (as measured by FTA / 36 minutes), and how they're doing once they get there.


(Having trouble seeing the chart? Click here.)
Some takeaways:

  • Perhaps nothing illustrates the growth on offense of DeMarcus Cousins better than this: in each of his first three seasons in the NBA, Cousins averaged between 6 and 7 FTA / 36 minutes. This year, he's the only qualified player in the NBA averaging over 10 FTA / 36. He's hitting 71% right now, right in line with his career average. If he can pull that up to 75% or higher... good golly, how do you stop him?
  • LOL Dwight Howard. Let's start with the good news: he still gets to the charity stripe a ton, and he's hitting free throws at a higher rate than in either of his past two seasons. So that's nice. On the other hand, he's missed 154 FTA so far. No one else on this chart has missed more than 86 (Blake Griffin). Dwight has missed 25 more FTA than Kevin Durant, James Harden, and Kevin Love combined, and that trio has taken 550 more total attempts than Howard.
  • Speaking of Durant, he's one made 3P and four FT away from shooting 50% 2P / 40% 3P / 90% FT. Amazingly, each of those percentages is actually down from last season.
  • LeBron James started the season red-hot (by his standards) from the stripe, shooting almost 80% through the end of November. Since then, however, he's been just a shade over 70%. His career average is 75%.
  • Tony Wroten? Tony Wroten! Philly has to be delighted that he (and his backcourt mate Michael Carter-Williams) are able to get to the line at will, especially when both are still under 21 and barely understand NBA offense. Unfortunately both of them are among the five worst on this chart at hitting their freebies. By the way, Wroten hit 72% last season in Memphis, but his 58% mark this year is exactly in line with what he shot in his lone college season, so I'm going to consider last year the outlier until further notice.
  • Check out the teams that have a pair of players on this list, and how they rank in offensive efficiency. The Rockets (with Harden and Dwight) are 4th in the NBA in points per 100 possessions. The Wolves (Love and Kevin Martin) are 5th, the Clips (Blake and Chris Paul) are 7th, the Pelicans (Anthony Davis and Tyreke Evans) are 8th, and the Suns (Goran Dragic and Eric Bledsoe) are 10th. Even the less-heralded Hawks (Jeff Teague and the ever-professional Paul Millsap) are 13th. That's not a coincidence - if you can consistently run two-man actions in the half-court that get you free points, you're well on your way to a powerful offense.
  • And finally, I can't not mention Swaggy P. Nick Young is getting to the line on a career-best 32% of his FG attempts, which is propelling him to a career mark in true shooting percentage as well. I understand the numerous criticisms of Mike D'Antoni - many of which are valid - but he's demonstrating again an amazing ability to put limited role players in a position to succeed on offense.

Wednesday, December 11, 2013

The top three-point shooting duos in the NBA

In today's NBA, virtually every team wants at least two (and preferably more) long-range shooters on the floor at all times. This opens up space inside for both post players and drivers, which can boost free throw rates and overall offensive efficiency as a result.

So which team has the best duo of three-point shooters?

I mapped 3P% vs 3PA/gm for each team's top two shooters, measured by total 3PA. (I put a minimum of 3.5 attempts/gm for each player, so if your favorite team isn't listed here, it's because you didn't have two players who met that criteria.)


Some takeaways:

  • It will surprise absolutely no one to see the Splash Brothers near the top-right of this chart. Stephen Curry and Klay Thompson are just doing their usual record-breaking thing (though Curry's 41.3% is really dragging his teammate down).
  • But how about Portland? Wesley Matthews continues to shoot out of his mind, and Damian Lillard may already be the second-best shooting lead guard in the league.
  • Kyle Korver is shooting precisely 50% on threes. I just... I mean... it's the only thing he really does, and teams still have no answer for it.
  • I love the way that Mike D'Antoni has deployed Jodie Meeks (46% from 3PT) and Steve Blake, as well as Shawne Williams and others, in his early-in-the-shot-clock, long-distance attack. It'll be interesting to see how this changes, in both volume and efficiency, with Kobe Bryant's return.
  • The fact that the Celtics with frickin' Jordan Crawford and Jeff Green are in the top left of this chart may be the strongest data point yet for Brad Stevens' Coach of the Year candidacy.
  • Ray Allen: under 39% so far. Shane Battier: hovering around 30%. These will improve - well at least Ray is guaranteed to, since he's a cyborg. And when they do, Miami's LeBron James-fueled, record-pace offense may get even better.
  • You knew the Pistons were going to suck here, correct?What you may not have realized is that Brandon Jennings is actually up to a respectable 36% from three-land. Josh Smith is at 27%. And has already chucked up 100 attempts, and is showing no signs of slowing down. (More on Smoove in the day ahead.)

Thursday, December 5, 2013

10 great stats from NBAwowy

Here are five quick nuggets from the treasure trove that is NBAwowy.com:

  1. With Marc Gasol on the floor, Mike Conley and Zach Randolph have true shooting percentages of 59.5 and 55.1, respectively. Without Marc, those dip to 50.2 and 50.6. Get better soon, Nasty.


  1. Just in case you thought (as I suspected) that Monta Ellis' growth this year was mostly from playing alongside Dirk Nowitzki: Monta with Dirk on the floor: 27.9 usage, 53.3 TS%. With Dirk on the bench: 27.5 usage, 59.5 TS%.
  2. The Kings are scoring 100 points per 100 possessions with Greivis Vasquez on the floor, which would rank about 20th in the NBA team rankings. Without Vasquez, they're scoring 108.5 points per 100 possessions, which would rank 2nd in the NBA, just behind the Heat's 108.8.
  3. Speaking of Miami, are we still pretending Udonis Haslem is integral to this team? With Udonis on the court, Miami scores 107 pts / 100 possessions and gives up a whopping 118 pts / 100 poss. With Udonis in the cheering section, the Heat outscore opponents 117.5 - 102 per 100 poss. More amazingly, in the 108 minutes that Haslem and LeBron James have played together, the Heat have been outscored by 20 points. UDONIS HASLEM CANCELS OUT LEBRON JAMES!
  4. LaMarcus Aldridge and Damian Lillard have been outstanding for the Blazers, and Wesley Matthews is shooting like Steve Kerr on steroids. But the real MVP for Portland might be Robin Lopez. With Lopez on the court, the Blazers outscore opponents 112-104 per 100 possessions. That's championship-level material. Without him, it's 110-109... basically a .500 team.


Tuesday, November 26, 2013

How efficient are the NBA's highest-usage players?

Here are the true shooting %'s for the 25 players with the highest usage rates in the NBA right now (min 240 mins played).


(Having trouble seeing the chart? Click here.)

Some takeaways:
  • LeBron James is killing the NBA softly with his efficiency. By the way, the modern-era record for TS%  (min 500 FGA) is 70.2%, by Artis Gilmore in 1981-82. The record for non-centers is Cedric Maxwell at just under 68%. LeBron has a great shot at busting that mark - while taking almost 50% more shots than Cornbread did.
  • Does Kevin Durant curse the existence of LeBron every day, or is it a weekly ritual? Durant's efficiency is startling and borderline historic... except it's overshadowed by this other guy at every turn. Let's just relish them both.
  • Monta Ellis finally does have it all! After posting TS% of 51% and 49% the past two years, Monta is over 59% this year. That's better than Stephen Curry, Tony Parker and Kevin Love. How is this happening? Simply put, he's doing everything better: taking fewer three's, shooting them more efficiently, and getting to the line at a far greater clip than ever before (7 FTA / 36 mins, compared to 4.5 FTA / 36 the past two seasons.) By the way, if this amazing transformation keeps up, this may become one of the strongest points in the Hall of Fame resume of Dirk Nowitzki. (Speaking of Dirk, he just misses the top 25 in usage on this chart, but his TS% is over 60%. That's a hell of a two-headed foundation for an offense.)
  • I'm going to excuse Russell Westbrook's inefficiency for now because he's coming back from a serious meniscus injury.He's been over 53% TS each of the past three seasons, and I expect he'll be back there soon.
  • What's up with DeMarcus Cousins? After a 28% usage rate last year, he's approaching 35% this year. His shooting isn't horrible, and he's actually passing pretty well (a 16% assist rate), so it'll be interesting to see if he can sustain this new level of volume and efficiency. Has losing Tyreke Evans has been addition by subtraction for DMC?

Monday, November 4, 2013

Is Michael Carter-Williams having the best start by a point guard... ever?

Here's a brief recap of what Michael Carter-Williams has done through his first three NBA games:

Scored 62 points. Dished 27 assists. Nabbed 14 rebounds. Grabbed 13 steals. Helped beat both Miami and Chicago. Saved the city of Philadelphia from itself (temporarily at least). Rescued a kitten.

Not a bad start, especially for a rookie who didn't make a first-, second-, or third-team All-American squad in either of his years in college. So how historic is MCW's start? Is it maybe the best start by a point guard in NBA history?

Before we see what the numbers say, one critical caveat: full game logs were only available starting in the 1985-86 season, and that's when our data starts. So Oscar Robertson (or Magic) may have started his career in full Beast Mode, but we just don't have access to the full details.

Let's start with all players who've tallied at least 30 total points and 15 total assists in the first 3 games of their career. The first chart maps their assists per 36 mins vs. points per 36 mins. I've highlighted John Wall (in blue) and MCW (in red) because they're so close to each other on this chart. Just for giggles, I've also highlighted LeBron James in gold.


So the only player who beats MCW (and Wall) in both Pts/36 and Ast/36 through 3 games is Mahmoud Abdul-Rauf, who played only 67 total minutes in his three games.

But of course, points and assists haven't been MCW's only contributions to date - far from it. Witness:


So how does MCW compare to the above players in other stats? Let's check out rebounding, steals, and protecting the ball. (Again, Carter-Williams in red, John Wall in blue, LeBron in gold.)


So comparatively speaking, Carter-Williams is strong in rebounding, third-best in assist:turnover ratio, and first in steals. Wow.

What does all this portend for Carter-Williams' future? I haven't a friggin' clue. He's certainly old for a rookie, especially one with only two years of college experience. (Krie Irving is five months younger than MCW.) On the other hand, his physical attributes are completely unlike other older rookies like Damian Lillard or Damon Stoudamire.

Regardless of what happens from here out, though, the start has been historically special.
Friday, November 1, 2013

5 early gems from the new NBA player tracking tool

If you haven't seen the new NBA Player Tracking tool yet, check it out. It uses SportVU cameras and software to track the movements of every player on every court for every NBA game. That means it can chart the movements and speed of every player, touches and passes, rebounding, defensive opportunities, and much more. It's going to be an amazing tool for fans to get a deeper, more nuanced understanding of the game.

Like for example, by jumping to impossibly early conclusions based on two games of data! But hey, it's fun, so here are five early nuggets that I found interesting and we'll keep tracking in the future. (Note: I'm only including data for players who've played two games so far, not one. See? I care about sample size!)

1. How some notable centers are doing defending the rim (min 6 FGA / gm at the rim):

Against Roy Hibbert: opponents are shooting 26% at the rim (btw, David West and Ian Mahinmi both qualify as well, and are at 38% and 37% respectively)
Chris Kaman: 17% (!)
Tyson Chandler: 32%
Andrew Bogut: 50%
Pau Gasol: 54%
Nikola Vucevic: 56%
Chris Bosh: 62%

2. Catch and shoot FG% (min 5 such FGA/gm):

Klay Thompson: 73%
LeBron James: 62.5%
Ray Allen: 41.7%
Carmelo Anthony: 40%
Wesley Johnson and Pau Gasol: 36% each
Arron Aflalo: 25%

Bonus: Stephen Curry doesn't qualify yet, but (yawn) he's at 75%.

3. Leaders in player time of possession per game (number of mins a player possesses the ball in mins):

Chris Paul: 7.9 mins out of 37 mins played
Derrick Rose: 6.6 mins, 32.9 mins played
Jameer Nelson: 6.2 mins, 35.5 mins played

Bonus: Klay Thompson has possessed the ball for just 1.1 mins / gm in order to score 24 ppg. That's 66 seconds per game.

4. Leaders in average speed on the court (in mph, min 20 mpg)

Norris Cole: 4.7 mph
JJ Redick: 4.7 mph
Kirk Hinrich: 4.6 mph
Steve Blake: 4.6 mph

5. Leaders in assist opportunities per gm (passes in which the teammate then attempts a shot):

CP3: 21.5 opptys/ gm, translating to 13 apg
Jameer Nelson: 18.5 opptys/ gm, 7.5 apg
LeBron: 18 opptys/ gm, 10.5 apg

Bonus: Poor D-Rose and Melo: each have 9.5 opptys/ gm, but only 3.5 apg


FINAL bonus: D-Rose has attempted 13 pull-up jumpers so far this season, and has made 0 of them.

Tuesday, October 29, 2013

LeBron James vs. the other active MVP's

Through 10 seasons, how does the career of LeBron James stack up against the other active MVP's? Here's a look at the year-by-year PER and minutes played for LeBron, Tim Duncan, Kobe Bryant, Kevin Garnett, Dirk Nowitzki, and Derrick Rose. (Yes, I excluded Steve Nash. Trust me, he doesn't really compare well on a season-by-season basis to these dominant stars.)


Quick Takeaways:

- Good God, LeBron. The combination of dominance and durability is frightening. On a year-by-year basis, he "wins" 8 of his 10 seasons so far vs. all these other Hall-of-Famers. Even if he starts experiencing a dip within the next year or two and follows the same trendline as others have, he could still be pumping out 26+ PER seasons until at least his mid-30's. Those are MVP caliber seasons. Until his mid-30's. Or later.
- Dirk's peak 4 years were really, really great.
- KG's peak was even (ever so slightly) better.
- I'd argue that Kobe's biggest strength isn't his peak (his two best seasons are lower than LeBron's, Garnett's or Dirk's), but rather how well he's held up in years 12+. It really adds to his legacy when you compare his later years to the other older superstars.
- D-Rose's growth from year 1 to year 3 was unusually strong. Let's hope his (real) year 5 brings more of the same.

I'm going to run this visualization again later in two other ways: once to pit LeBron against current stars like Durant, Dwight and Wade, and then to pit him against all-timers like MJ, Bird, Magic and Hakeem. Let me know if there's anyone in particular you want to see on either of those visualizations.